A State-Wise & Product-Wise Overview of Fuel Demand Patterns: India, with its ever-expanding economy and rising energy needs, remains a critical player in the global oil and gas landscape. As the country continues to strengthen its position as the 4th largest economy and sets its sight on becoming the 3rd largest, its petroleum product consumption trends reflect a growing energy appetite driven by infrastructure, mobility, and household demand.
The Petroleum Planning & Analysis Cell (PPAC), under the Ministry of Petroleum & Natural Gas, has published a comprehensive report detailing state-wise estimated petroleum product consumption for the FY 2025–26, showcasing how various fuel types—LPG, MS, HSD, and ATF—are distributed across India.
National-Level Consumption Estimates (in TMT)
| Product | Estimated Consumption FY 2025–26 |
|---|---|
| LPG | 32,790 TMT |
| MS (Petrol) | 42,663 TMT |
| HSD (Diesel) | 93,946 TMT |
| ATF (Aviation Fuel) | 9,871 TMT |
India’s High-Speed Diesel (HSD) consumption dominates at over 93 MMT, driven largely by road freight, agriculture, and industrial use. Motor Spirit (MS) or petrol follows at over 42 MMT, propelled by a surge in personal vehicle ownership. Liquefied Petroleum Gas (LPG) maintains a solid presence at 32.7 MMT, crucial for both urban kitchens and rural households under the Ujjwala scheme. Aviation Turbine Fuel (ATF) is pegged at 9.8 MMT, pointing to continued recovery in air travel.
Region-Wise Highlights
Northern Region:
-
Uttar Pradesh leads India in HSD (10,899 TMT) and MS (5,134 TMT) consumption.
-
Delhi reports the highest ATF demand at 2,788 TMT, due to being a major aviation hub.
-
Total North India petroleum consumption:
-
HSD: 28,342 TMT
-
MS: 12,818 TMT
-
LPG: 10,223 TMT
-
ATF: 3,629 TMT
-
Southern Region:
-
Tamil Nadu and Karnataka are major consumers of all four petroleum products.
-
South India totals:
-
HSD: 25,395 TMT
-
MS: 12,741 TMT
-
LPG: 8,905 TMT
-
ATF: 2,971 TMT
-
Western Region:
-
Maharashtra leads India in total fuel consumption, with HSD at 10,761 TMT and MS at 4,701 TMT.
-
Gujarat also posts high industrial demand with 7,508 TMT of HSD.
-
Regional totals:
-
HSD: 25,671 TMT
-
MS: 10,926 TMT
-
Eastern & Northeastern Regions:
-
West Bengal and Odisha are the top fuel consumers in the East.
-
The Northeast, although lower in volume, shows significant reliance on LPG and MS due to limited pipeline coverage and rugged terrain.
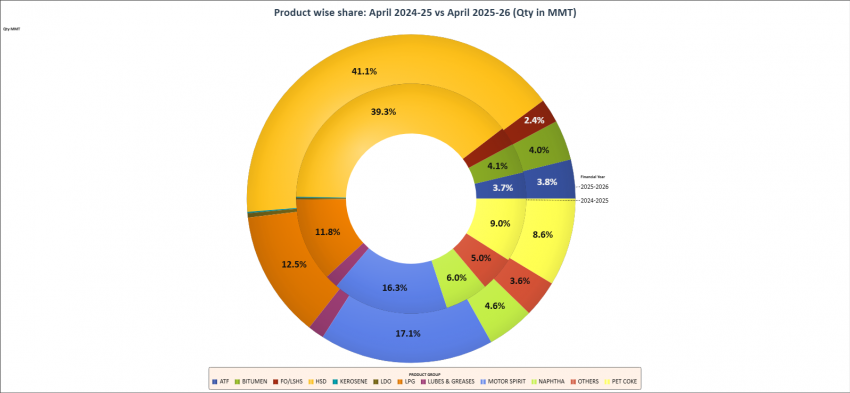
Analysis of Product Share: 2024-25 vs 2025-26
A dual-ring donut chart from PPAC visually compares product-wise petroleum share over two financial years:
| Petroleum Product | Share in FY 2024–25 (%) | Share in FY 2025–26 (%) | Trend / Insight |
|---|---|---|---|
| HSD (High-Speed Diesel) | 39.3% | 41.1% | ↑ Growing freight and industrial demand |
| MS (Motor Spirit / Petrol) | 16.8% | 17.1% | ↑ Increase in personal vehicle usage |
| LPG | 16.3% | 16.3% | → Stable due to continued domestic demand |
| ATF (Aviation Fuel) | 3.7% | 3.8% | ↑ Aviation sector recovery post-COVID |
| Kerosene (SKO) | 1.1% | 0.9% | ↓ Reduced due to clean cooking shift |
| FO/LSHS | 6.3% | 5.9% | ↓ Decreasing use in industrial processes |
| Bitumen | 5.8% | 5.7% | → Stable; construction-linked demand |
| Others | 10.7% | 9.2% | ↓ Indicates energy diversification and shift |
-
HSD remains the highest at 41.1% in FY 2025–26 (up from 39.3%).
-
MS follows at 17.1%, showing increased mobility trends.
-
LPG share remains steady at 16.3%, supported by consistent Ujjwala adoption.
-
ATF saw a marginal increase from 3.7% to 3.8%, highlighting aviation recovery.
-
Lesser-used fuels like Kerosene, FO/LSHS, and Bitumen have stabilized or declined in share, indicating energy transition progress.
Conclusion: A Sector on the Rise
India’s petroleum product demand pattern reinforces its rapid economic transformation and urbanization, making energy security and infrastructure investment critical. With states like Uttar Pradesh, Maharashtra, Tamil Nadu, and Gujarat acting as demand centers, oil marketing companies (OMCs) and policymakers must continue investing in pipeline connectivity, CGD networks, LNG terminals, and EV infrastructure.
This state-wise consumption map is not only a strategic input for energy planning and logistics but also an invaluable reference for stakeholders, from policymakers to logistics firms, CGD operators, and competitive exam aspirants targeting the energy sector.
Source:
Petroleum Planning & Analysis Cell (PPAC), Ministry of Petroleum & Natural Gas, Govt. of India
Estimated Petroleum Product Consumption Report (FY 2025-26)